
Contents
- Reports Overview
- Bad Clients – Summary
- Bad Clients – Summary by IP Address
- Bad Clients – Summary by IP Address (/24)
- Top 100 Requests (FQDNs)
- Queries by Name Server
Reports Overview
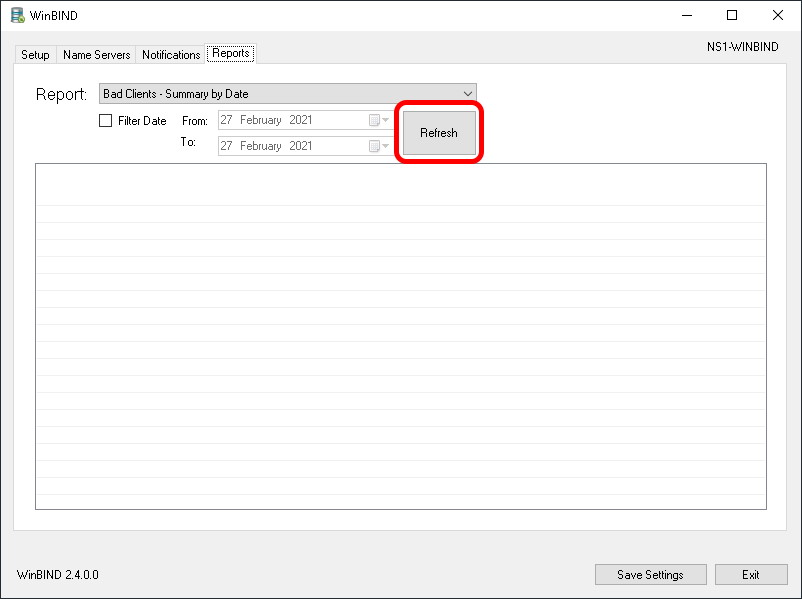
Reports are accessible from the Reports tab of WinBIND Control. Choose the desired report from the drop-down list, optionally set a date filter and then click on Refresh
Bad Clients – Summary
This shows the number of bad clients detected by WinBIND (and blocked using the Windows Firewall) for each given date.
Bad Clients – Summary by IP Address
This shows the number of times each specific bad client has been detected by WinBIND in a given date range. WinBIND keeps track of when bad clients are added and removed from the system so that repeat offenders can more easily be detected.
If you tick Attempt reverse DNS lookup then WinBIND will attempt to show you the reverse DNS record for the top 10 Bad Clients.
Bad Clients – Summary by IP Address (/24)
This is very similar to previous report (Summary by IP Address) but discounts the last octet when aggregating bad clients. It allows you to more easily identify target netblocks.
Bad Clients – Summary by Request
This shows the FQDN of the request being made the Bad Clients – it’s a useful way to try and understand what your name server is being to process be the malicious actors
Queries by Name Server
This shows you the number of queries logged by each name server for each given date, along with a total for all name servers.
This report uses some red/green colouring to indicate relative performance. The row is coloured red if the total queries for that date was higher than the average across all selected days. It is coloured green if the total queries for that date were lower than the average. It allows you to identify peak days at a glance, particularly if you think you may have been under heavy load during a particular timeframe
Top 100 Clients
This shows the top 100 clients by IP address.
If you tick Attempt reverse DNS lookup then WinBIND will attempt to show you the reverse DNS record for the top 10 clients (not the top 100, that could take too long and stall the Report if many IP addresses do not have a matching rDNS record)
Top 100 Queries (historic)
This shows the top 100 queries (requests, or FQDNs) made against your name servers in the specified date range (or all time).
Warning: this report can place a heavy load on your SQL server if you have a large database
Top 100 Queries (live)
This shows the top 100 queries (requests, or FQDNs) made against your name servers within the last hour
This report will be replaced in v3.0 with the upcoming Live Stats feature. Please see the Changelog for more information and contact me if you’d like to be involved in testing v3.0 in a beta capacity.
Support, Feedback and Additional Reports
If you have any problems, if you get any error messages, or if you would like any additional reports added to WinBIND then please get in touch – I really do want to hear from you!